Eyes on Intel: Market Reaction to CEO Exit and Key Stock Levels to Watch!
2024-12-03
Author: Ming
Intel Corporation (INTC) finds itself under heightened scrutiny as the chip giant announces the unexpected departure of CEO Pat Gelsinger, effective as of Monday, and introduces a dual interim co-CEO structure while they hunt for a permanent replacement. This shakeup comes at a pivotal moment for Intel, which is grappling with numerous challenges as it attempts to regain its footing in a fiercely competitive semiconductor market.
Since Gelsinger took the helm in February 2021, he has been at the forefront of Intel's ambitious turnaround strategy. However, this plan has been accompanied by marked job cuts and asset sales, reflecting the company's struggle to retain market share against aggressive rivals like AMD and Nvidia. Investors have grown increasingly anxious as Intel reported a staggering net loss in Q2 of 2023, generating speculation about significant strategic overhauls and potential mergers or acquisitions, which, sadly, have not rekindled investor confidence.
In the wake of Gelsinger's announcement, Intel's stock initially surged as much as 6% but ultimately closed down 0.5%, hovering around $24 in early trading on Tuesday. This volatility highlights the uncertain sentiment around the company's future direction.
Navigating Intel's Stock: Key Support and Resistance Levels
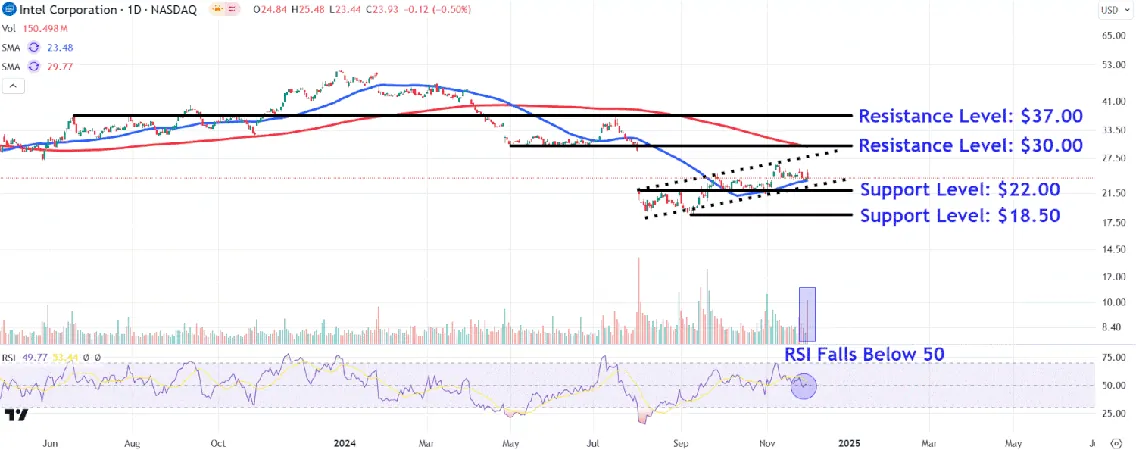
Recent trading patterns indicate a potential shift in market dynamics. Despite a notable decline of over 25% experienced in early August, Intel's shares have managed to trade within an ascending channel, showcasing their ability to rebound. However, Monday's move toward the 50-day moving average (MA) was accompanied by the highest trading volume seen in over a month, suggesting that selling pressures are intensifying.
Equally important is the Relative Strength Index (RSI), which recently slipped below the 50 mark, indicating a potential loss of momentum in price movement. This scenario beckons investors to closely monitor several critical price thresholds.
Key Support Levels
A breach below the 50-day moving average signals a potential decline toward the $22 mark. This level coincides with a pivotal area established at the onset of an early August gap and reflects historical trading patterns from late summer to early fall. Should the stock fall below $22, investors may eye the $18.50 support zone as a prime opportunity for bargain hunting—approximately 23% lower than Monday’s closing price.
Important Resistance Levels
On the flip side, a rally could face resistance near the $30 threshold, where the 200-day moving average converges with the lower segment of a preceding consolidation period from earlier in the year. Furthermore, a more substantial upward rally could see shares climbing toward the $37 level—an area where investors who purchased at lower prices might consider locking in profits along a trendline connecting peaks from June 2023 to July.
In summary, as Intel navigates this critical juncture marked by leadership changes and market pressures, investors are urged to keep a close watch on these technical indicators. The future of Intel hangs in the balance, and every movement could be a sign of either recovery or further calamity. Stay tuned as we continue to monitor the unfolding situation!


 Brasil (PT)
 Canada (EN)
 Chile (ES)
 España (ES)
 France (FR)
 Hong Kong (EN)
 Italia (IT)
 日本 (JA)
 Magyarország (HU)
 Norge (NO)
 Polska (PL)
 Schweiz (DE)
 Singapore (EN)
 Sverige (SV)
 Suomi (FI)
 Türkiye (TR)