Traders on Edge as Stocks Plunge: Will the Market Rally or Crash?
2025-03-31
Author: Ming
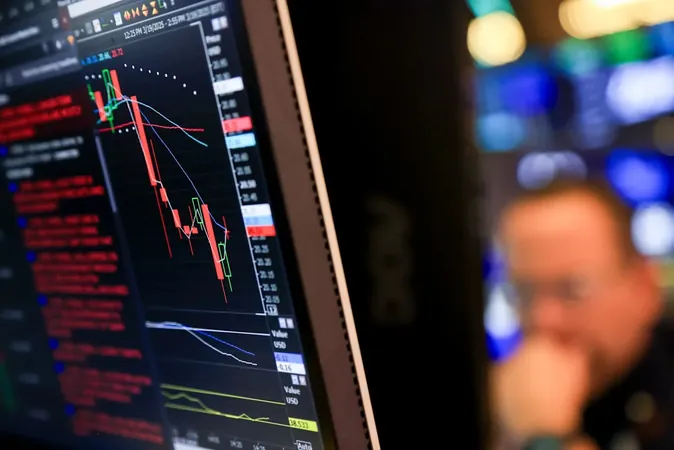
As the stock market experiences a dramatic downturn fueled by trade uncertainties and fears of slowing economic growth, traders are closely monitoring critical technical charts to predict its next move. The S&P 500 Index (^SPX) initially dipped below a significant threshold of 5,504.65—its most recent intraday low from March 13. However, it quickly rebounded and was down 1.2% at around 5,516 by 10:26 AM in New York.
"The rebound from this low signals that there are buyers ready to step in," said JC O'Hara, chief market technician at Roth Capital Partners. "Everyone will be watching to see if the bulls can defend that level again." The current environment showcases the intense psychological battle between buyers and sellers.
Traders are anxiously awaiting the crucial April 2 deadline, when President Donald Trump’s administration is set to introduce “reciprocal tariffs” affecting all countries. Wall Street strategists have raised alarms about the potential risks to U.S. equities due to the ongoing ambiguity surrounding trade policies.
"When the economic landscape is as murky as it is now—whether regarding growth prospects, geopolitical tensions, or corporate earnings—technical analysis becomes increasingly valuable," explained Mark Hackett, chief market strategist at Nationwide. "Technicals act as a barometer, capturing investor sentiments and their trading behaviors."
If the S&P 500 concludes below its March 13 low, analysts predict minimal support until it hits 5,400—a further decline of 3.2% from Friday’s close. This precarious position has traders on high alert.
In addition to price levels, market breadth also comes under scrutiny. Adam Turnquist, chief technical strategist at LPL Financial, indicated that a reading of 10% or lower in the percentage of stocks trading above their 20-day moving average would potentially signal a capitulation—an indicator of extreme investor nervousness.
The CBOE Volatility Index, commonly referred to as the VIX, is another major focus. Currently hovering around 24, this level suggests a rise in trader anxiety. Market experts are particularly concerned about whether it will surge past the critical 30 threshold, a potential indication of heightened distress in the market. According to derivatives strategist Jeff Jacobson at 22V Research, the VIX must challenge the earlier high of 29.57 before any market stabilization can be anticipated.
As volatility grips the markets, traders remain on edge, weighing both the technical indicators and the looming economic ramifications tied to trade policies. The coming days will prove crucial in determining whether we're witnessing the dawn of a new market rally or facing the ominous depths of a financial crash. Stay tuned for what could be a pivotal moment in stock market history!


 Brasil (PT)
 Canada (EN)
 Chile (ES)
 Česko (CS)
 대한민국 (KO)
 España (ES)
 France (FR)
 Hong Kong (EN)
 Italia (IT)
 日本 (JA)
 Magyarország (HU)
 Norge (NO)
 Polska (PL)
 Schweiz (DE)
 Singapore (EN)
 Sverige (SV)
 Suomi (FI)
 Türkiye (TR)
 الإمارات العربية المتحدة (AR)